การวิเคราะห์ข้อสอบที่เชื่อถือได้ เชื่อมโยงความเชื่อมั่น ความยาก และอำนาจจำแนก
Trust the Test Item Analysis Linking Reliability, Item Difficulty, and Item Discrimination
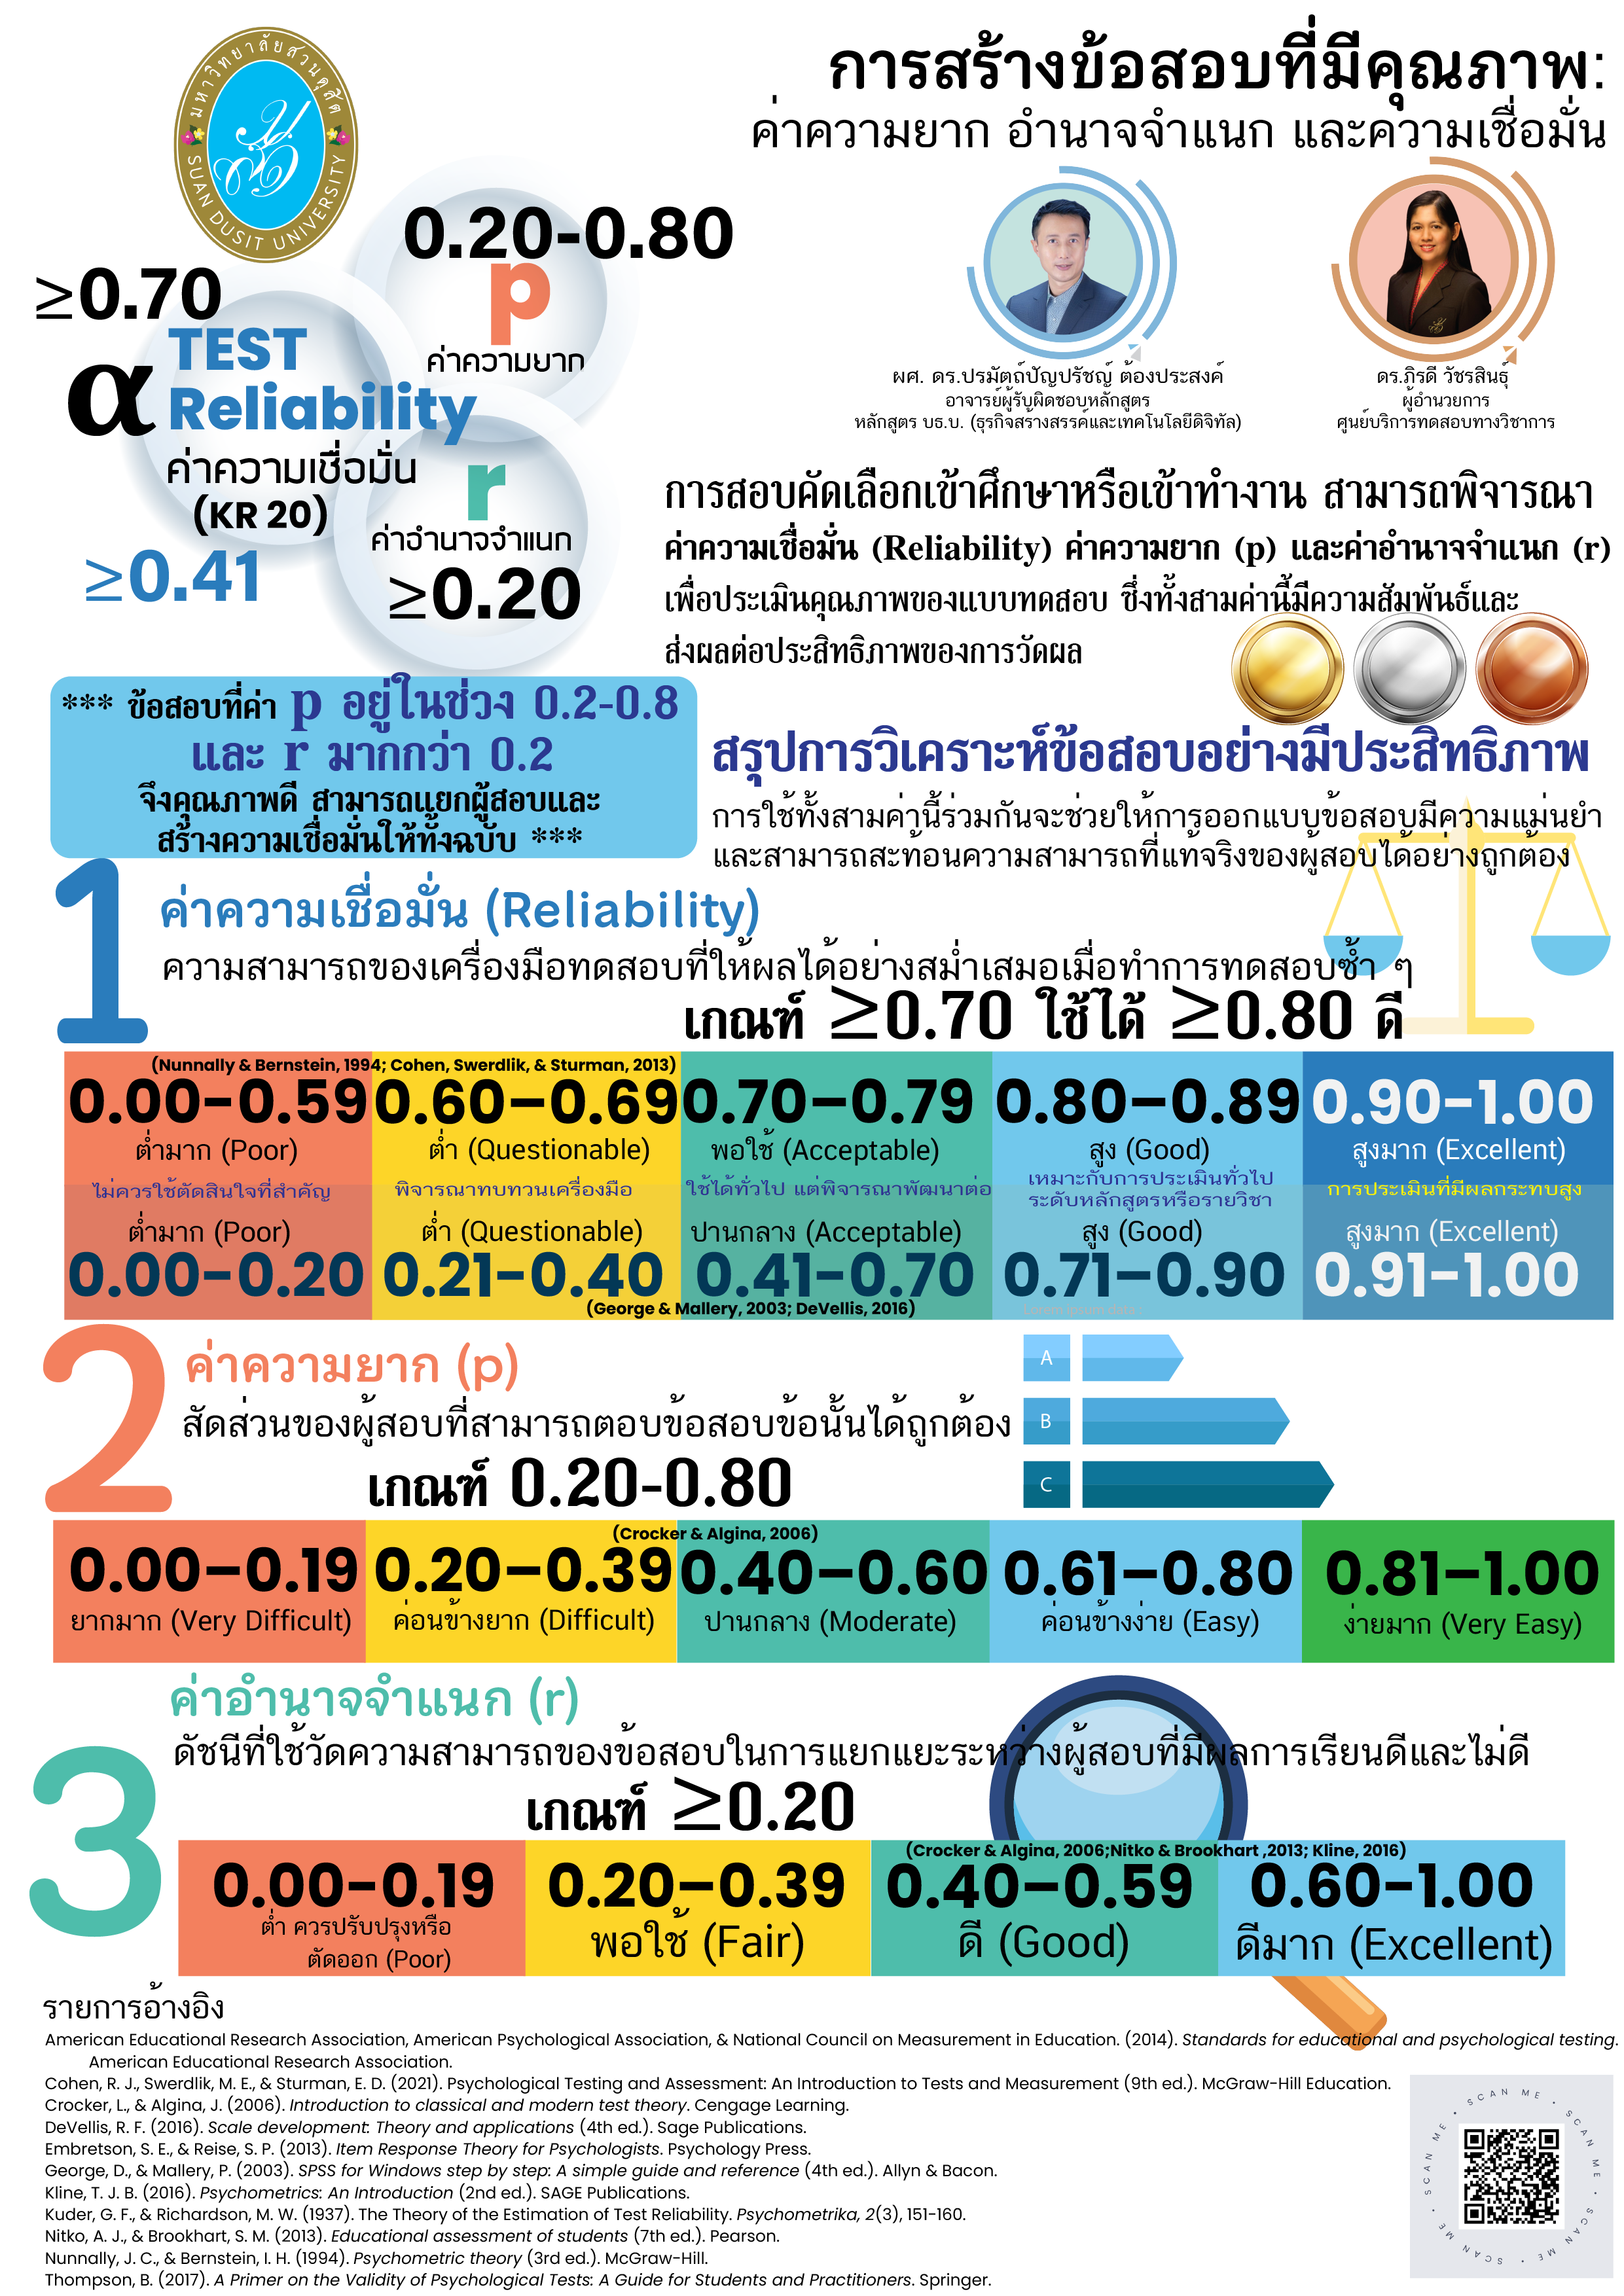
ภาพ การวิเคราะห์ข้อสอบควรพิจารณาค่า p, r และความเชื่อมั่นร่วมกัน
ที่มา: ปรมัตถ์ปัญปรัชญ์ ต้องประสงค์ และภิรดี วัชรสินธุิ์. (2568).
Figure High-quality tests require analysis of p, r, and reliability.
Source: Tongprasong & Watcharasin. (2525).
การวิเคราะห์ข้อสอบเพื่อการสอบคัดเลือกที่เชื่อถือได้
การเชื่อมโยงความเชื่อมั่น ความยาก และอำนาจจำแนก
การสอบคัดเลือกเพื่อเข้าศึกษาต่อหรือเข้าทำงาน จำเป็นต้องอาศัยแบบทดสอบที่มีคุณภาพ การวิเคราะห์ข้อสอบจึงเป็นกระบวนการสำคัญในการประเมินคุณภาพของเครื่องมือวัด โดยพิจารณาค่าทางจิตมิติหลัก ได้แก่ ค่าความเชื่อมั่น (Reliability), ค่าความยาก (p) และ ค่าอำนาจจำแนก (r) ซึ่งมีความสัมพันธ์กันและส่งผลต่อความแม่นยำของผลการทดสอบ
1. ค่าความเชื่อมั่น (Reliability)
ค่าความเชื่อมั่น หมายถึง ความสามารถของแบบทดสอบในการให้ผลการวัดที่สม่ำเสมอ เมื่อทำการทดสอบซ้ำในเงื่อนไขที่ใกล้เคียงกัน การคำนวณสามารถทำได้หลายวิธี เช่น Cronbach’s α, KR-20, test-retest และ split-half โดยทั่วไป ค่า α หรือ KR-20 ≥ 0.70 ถือว่ายอมรับได้ และ ≥ 0.80 ถือว่าอยู่ในระดับดี
งานวิจัยพบว่า ข้อสอบที่มี p อยู่ในช่วง 0.20–0.80 และมีค่า r สูง จะช่วยแยกแยะผู้สอบที่มีความสามารถแตกต่างกันได้ดี ส่งผลให้ค่าความเชื่อมั่นของแบบทดสอบทั้งฉบับสูงขึ้น (Cohen, Swerdlik, & Sturman, 2021)
ตาราง 1 การแปลความหมายค่า Cronbach’s α
| ค่า Reliability (α) | การแปลความหมาย | คำแนะนำในการใช้งาน |
|---|---|---|
| 0.90–1.00 | สูงมาก | เหมาะสำหรับการประเมินที่มีผลกระทบสูง |
| 0.80–0.89 | สูง | เหมาะกับการประเมินทั่วไป |
| 0.70–0.79 | พอใช้ | ใช้ได้ แต่ควรพัฒนาเพิ่มเติม |
| 0.60–0.69 | ต่ำ | ควรทบทวนแบบทดสอบ |
| ต่ำกว่า 0.60 | ต่ำมาก | ไม่เหมาะต่อการตัดสินใจที่สำคัญ |
Test Item Analysis for Credible Selection Assessment
Linking Reliability, Item Difficulty, and Item Discrimination
Selection examinations for admission or employment require high-quality assessment instruments. Item analysis is a critical process for evaluating test quality through key psychometric indices, including reliability, item difficulty (p), and item discrimination (r). These indices are interrelated and directly influence the accuracy and credibility of assessment results.
1. Reliability
Reliability refers to the consistency and stability of test scores across repeated administrations under similar conditions. Common estimation methods include Cronbach’s alpha, KR-20, test-retest, and split-half reliability. In practice, a coefficient of α or KR-20 ≥ 0.70 is considered acceptable, while ≥ 0.80 indicates good reliability.
Empirical evidence shows that items with moderate difficulty (p = 0.20–0.80) and higher discrimination (r) more effectively differentiate examinees of varying ability, thereby increasing overall test reliability (Cohen, Swerdlik, & Sturman, 2021).
Table 1 Interpretation of Cronbach’s Alpha
| Reliability (α) | Interpretation | Recommended Use |
|---|---|---|
| 0.90–1.00 | Excellent | High-stakes assessment |
| 0.80–0.89 | Good | General assessment use |
| 0.70–0.79 | Acceptable | Usable with improvement |
| 0.60–0.69 | Questionable | Revision recommended |
| < 0.60 | Poor | Not recommended |
2. ค่าความยากของข้อสอบ (Item Difficulty; p)
ค่าความยากของข้อสอบ (p-value) หมายถึง สัดส่วนของผู้สอบที่สามารถตอบข้อสอบข้อนั้นได้ถูกต้อง ซึ่งสะท้อนระดับความง่ายหรือความยากของข้อสอบแต่ละข้อ หากค่า p สูงใกล้ 1 แสดงว่าข้อสอบง่ายเกินไป ในขณะที่ค่า p ต่ำใกล้ 0 แสดงว่าข้อสอบยากเกินไป (Nitko & Brookhart, 2013)
โดยทั่วไป ค่า p คำนวณจากสัดส่วนของผู้สอบที่ตอบถูก หากข้อสอบมีค่า p สูง จะไม่สามารถจำแนกผู้สอบที่มีความสามารถแตกต่างกันได้อย่างมีประสิทธิภาพ เช่นเดียวกับข้อสอบที่มีค่า p ต่ำมาก ซึ่งยากเกินไปสำหรับผู้สอบส่วนใหญ่
การเลือกใช้ข้อสอบที่มีค่า p อยู่ในช่วง 0.20–0.80 จะช่วยให้ข้อสอบสามารถแยกแยะความสามารถของผู้สอบได้ดี และส่งผลให้ค่าความเชื่อมั่น (reliability) ของแบบทดสอบสูงขึ้น (Embretson & Reise, 2013; Kline, 2016) ทั้งนี้ ข้อสอบที่ง่ายหรือยากเกินไป ทำให้ไม่สามารถจำแนกระดับผู้สอบได้อย่างแม่นยำ (Crocker & Algina, 2006)
เมื่อพิจารณาความเชื่อมโยงระหว่าง p, r และ Reliability พบว่าข้อสอบที่มีค่าความยากเหมาะสม จะช่วยเพิ่มค่าอำนาจจำแนก (r) และส่งผลให้ผลการทดสอบมีความแม่นยำและน่าเชื่อถือมากขึ้น (Embretson & Reise, 2013; Kline, 2016)
ตัวอย่างการคำนวณ:
ผู้สอบตอบถูก จำนวน 45 คน จากทั้งหมด 50 คน
45 / 50 → p = 0.90
ตาราง 2 เกณฑ์มาตรฐานในการตีความค่า p
| ค่า p | ความยากของข้อสอบ | ข้อเสนอแนะ |
|---|---|---|
| 0.00–0.19 | ยากมาก | ควรปรับปรุงหรือยกเลิก |
| 0.20–0.39 | ค่อนข้างยาก | ใช้ได้หากต้องการวัดผู้มีความสามารถสูง |
| 0.40–0.60 | ปานกลาง | เหมาะสมที่สุด |
| 0.61–0.80 | ค่อนข้างง่าย | ใช้เพื่อรักษาดุลยภาพของข้อสอบ |
| 0.81–1.00 | ง่ายมาก | ควรปรับหรือตัดออกจากชุดข้อสอบ |
ที่มา: Crocker & Algina (2006)
2. Item Difficulty (p)
Item difficulty (p-value) refers to the proportion of examinees who answer an item correctly. It indicates how easy or difficult a test item is. A p value close to 1 suggests that the item is too easy, whereas a value close to 0 indicates that the item is overly difficult (Nitko & Brookhart, 2013).
In practice, item difficulty is calculated as the ratio of correct responses to the total number of examinees. Extremely easy or extremely difficult items provide limited information and fail to effectively differentiate examinees with different ability levels.
Selecting items with p values between 0.20 and 0.80 enhances the ability of a test to distinguish between high- and low-performing examinees, which in turn increases overall test reliability (Embretson & Reise, 2013; Kline, 2016). Items that are too easy or too difficult typically show weak discrimination (Crocker & Algina, 2006).
When considered together with item discrimination (r) and reliability, appropriately difficult items contribute to higher discrimination indices and more accurate, trustworthy assessment outcomes (Embretson & Reise, 2013; Kline, 2016).
Example:
If 45 out of 50 examinees answer an item correctly,
45 / 50 → p = 0.90
Table 2 Interpretation of Item Difficulty (p)
| p Value | Item Difficulty | Recommendation |
|---|---|---|
| 0.00–0.19 | Very Difficult | Revise or discard |
| 0.20–0.39 | Difficult | Useful for high-ability assessment |
| 0.40–0.60 | Moderate | Most appropriate |
| 0.61–0.80 | Easy | Maintain test balance |
| 0.81–1.00 | Very Easy | Revise or remove |
Source: Crocker & Algina (2006)
3. ค่าอำนาจจำแนกของข้อสอบ (Item Discrimination; r)
ค่าอำนาจจำแนก (r) หมายถึง ดัชนีที่ใช้วัดความสามารถของข้อสอบในการแยกแยะระหว่างผู้สอบ ที่มีผลการเรียนหรือความสามารถสูงกับผู้สอบที่มีผลการเรียนหรือความสามารถต่ำ โดยทั่วไปคำนวณจากความสัมพันธ์ระหว่างคะแนนรายข้อกับคะแนนรวมของแบบทดสอบ
ค่า r ที่สูง แสดงว่าข้อสอบข้อนั้นสามารถจำแนกผู้สอบได้ดี กล่าวคือ ผู้ที่มีความสามารถสูงมีแนวโน้มตอบถูก ในขณะที่ผู้ที่มีความสามารถต่ำมีแนวโน้มตอบผิด ซึ่งถือเป็นคุณลักษณะที่สำคัญของข้อสอบที่มีคุณภาพ
เมื่อพิจารณาความเชื่อมโยงกับ Reliability และ p พบว่า ค่า r ที่สูง ช่วยให้การแยกแยะกลุ่มผู้เรียนมีความชัดเจนและแม่นยำมากขึ้น ส่งผลให้ค่าความเชื่อมั่นของแบบทดสอบโดยรวมเพิ่มสูงขึ้น (Thompson, 2017)
ตาราง 3 เกณฑ์การแปลความหมายค่าอำนาจจำแนก (r)
| ค่า r | การแปลความหมาย |
|---|---|
| 0.60–1.00 | ดีมาก (Excellent) |
| 0.40–0.59 | ดี (Good) |
| 0.20–0.39 | พอใช้ (Fair) |
| 0.00–0.19 | ต่ำ ควรปรับปรุงหรือตัดออก (Poor) |
ที่มา: Crocker & Algina (2006); Nitko & Brookhart (2013); Kline (2016)
Table 3. Item Discrimination (r)
Item discrimination (r) refers to an index that indicates how well an item distinguishes between high-performing and low-performing examinees. It is commonly calculated as the correlation between an individual item score and the total test score.
A high r value indicates that the item effectively differentiates examinees according to their ability levels, meaning that high-ability examinees tend to answer the item correctly, whereas low-ability examinees tend to answer incorrectly.
When considered in relation to reliability and item difficulty (p), higher discrimination values enhance the clarity and precision of score interpretation and contribute to increased overall test reliability (Thompson, 2017).
Interpretation of Item Discrimination (r)
| r Value | Interpretation |
|---|---|
| 0.60–1.00 | Excellent |
| 0.40–0.59 | Good |
| 0.20–0.39 | Fair |
| 0.00–0.19 | Poor (Revise or remove) |
Source: Crocker & Algina (2006); Nitko & Brookhart (2013); Kline (2016)
การวิเคราะห์ข้อสอบอย่างมีประสิทธิภาพ
การพิจารณาค่าความเชื่อมั่น (Reliability) ค่าความยาก (p) และค่าอำนาจจำแนก (r) ร่วมกัน ช่วยให้การวิเคราะห์ข้อสอบมีความน่าเชื่อถือและแม่นยำมากยิ่งขึ้น โดยสามารถสรุปสาระสำคัญได้ดังนี้
- ค่าความเชื่อมั่น (Reliability) ช่วยประเมินความเสถียรของการทดสอบ การตรวจสอบค่าความเชื่อมั่นช่วยให้มั่นใจได้ว่าเครื่องมือทดสอบ จะให้ผลที่คงที่และสม่ำเสมอจากการทดสอบซ้ำ ๆ
- ค่าความยาก (p) ช่วยตรวจสอบว่าข้อสอบแต่ละข้ออยู่ในระดับที่เหมาะสม ไม่ง่ายหรือยากเกินไป เพื่อให้สามารถแยกแยะความสามารถของผู้สอบได้อย่างมีประสิทธิภาพ
- ค่าอำนาจจำแนก (r) ช่วยแยกแยะผู้สอบที่มีผลการเรียนหรือความสามารถสูง ออกจากผู้สอบที่มีผลการเรียนหรือความสามารถต่ำได้อย่างชัดเจน
การใช้ค่าทั้งสามนี้ร่วมกัน จะช่วยให้การออกแบบและพัฒนาแบบทดสอบมีความแม่นยำ และสามารถสะท้อนความสามารถที่แท้จริงของผู้สอบได้อย่างถูกต้อง
ความสัมพันธ์ระหว่าง p, r และความเชื่อมั่น
- ข้อสอบที่มีค่า p อยู่ในช่วง 0.20–0.80 และมีค่า r มากกว่า 0.20 ถือว่ามีคุณภาพดี สามารถแยกผู้สอบได้ และช่วยเพิ่มความเชื่อมั่นของแบบทดสอบทั้งฉบับ
- สูตร KR-20 ใช้ค่า p และ q (1–p) เป็นองค์ประกอบสำคัญในการคำนวณค่าความเชื่อมั่น สำหรับแบบทดสอบข้อปรนัย
- สรุปเชิงประยุกต์แสดงดังตาราง 4
ตาราง 4 สรุปเกณฑ์เชิงประยุกต์
| ตัวชี้วัด | เกณฑ์มาตรฐาน |
|---|---|
| p | 0.20–0.80 |
| r | ≥ 0.20 |
| Reliability (α / KR-20) | ≥ 0.70–0.80 |
ข้อเสนอแนะในการจัดทำข้อสอบ
- พัฒนาและวิเคราะห์ค่า p และ r รายข้อ
- ตรวจสอบค่า α หรือ KR-20 เพื่อประเมินความเชื่อมั่นของแบบทดสอบทั้งฉบับ
- ปรับปรุงข้อสอบที่มีค่า p หรือ r ต่ำ และตรวจสอบรูปแบบการเขียนข้อสอบเพื่อยกระดับคุณภาพของเครื่องมือ
Effective Test Item Analysis
Considering reliability, item difficulty (p), and item discrimination (r) together enhances the accuracy and trustworthiness of test item analysis. The key points can be summarized as follows.
- Reliability assesses the stability and consistency of test scores. Examining reliability ensures that the test yields consistent results when administered repeatedly.
- Item Difficulty (p) indicates whether test items are appropriately challenging— neither too easy nor too difficult— allowing for effective differentiation among examinees.
- Item Discrimination (r) reflects how well an item distinguishes between high-performing and low-performing examinees.
Using these three indices together supports precise test design and ensures that assessment results accurately reflect the true abilities of examinees.
Relationship among p, r, and Reliability
- Items with p values between 0.20 and 0.80 and r values greater than 0.20 are considered high-quality items, capable of differentiating examinees and enhancing overall test reliability.
- The KR-20 formula incorporates p and q (1–p) in estimating the reliability of multiple-choice tests.
- An applied summary is presented in Table 4.
Table 4 Applied Summary of Evaluation Criteria
| Indicator | Standard Criterion |
|---|---|
| p | 0.20–0.80 |
| r | ≥ 0.20 |
| Reliability (α / KR-20) | ≥ 0.70–0.80 |
Recommendations for Test Development
- Develop and analyze p and r for each item
- Examine α or KR-20 to evaluate overall test reliability
- Revise items with low p or r values and refine item wording to improve test quality
คณะทำงาน
หลักสูตรบริหารธุรกิจบัณฑิต
สาขาวิชาธุรกิจสร้างสรรค์และเทคโนโลยีดิจิทัล
มหาวิทยาลัยสวนดุสิต
 ผศ. ดร.ลัดดา สวนมะลิ
 ผศ. สุภารัตน์ คุ้มบำรุง
 ผศ. ชวาลิน เนียมสอน
 ผศ. กนิษฐา ศรีเอนก
 ผศ. ดร.อัญชนา ลักษณ์วิรามสิริ
Project Team
B.B.A. Program in Creative Business and Digital Technology
Suan Dusit University
Asst. Prof. Dr. Ladda Suanmali
Asst. Prof. Suparat Khumbamrung
Asst. Prof. Chawalin Niamsorn
Asst. Prof. Kanitha Srianek
Asst. Prof. Dr. Anchana Lakviramsiri
รายการอ้างอิง
References
American Educational Research Association et al. (2014). Standards for educational and psychological testing.
Cohen, R. J., Swerdlik, M. E., & Sturman, E. D. (2021). Psychological Testing and Assessment: An Introduction to Tests and Measurement (9th ed.). McGraw-Hill Education.
Crocker, L., & Algina, J. (2006). Introduction to classical and modern test theory. Cengage Learning.
DeVellis, R. F. (2016). Scale development: Theory and applications (4th ed.). Sage Publications.
Embretson, S. E., & Reise, S. P. (2013). Item Response Theory for Psychologists. Psychology Press.
George, D., & Mallery, P. (2003). SPSS for Windows step by step: A simple guide and reference (4th ed.). Allyn & Bacon.
Kline, T. J. B. (2016). Psychometrics: An Introduction (2nd ed.). SAGE Publications.
Kuder, G. F., & Richardson, M. W. (1937). The Theory of the Estimation of Test Reliability. Psychometrika, 2(3), 151–160.
Nitko, A. J., & Brookhart, S. M. (2013). Educational assessment of students (7th ed.). Pearson.
Nunnally, J. C., & Bernstein, I. H. (1994). Psychometric theory (3rd ed.). McGraw-Hill.
Thompson, B. (2017). A Primer on the Validity of Psychological Tests: A Guide for Students and Practitioners. Springer.